CO₂ Generation Rates

Calculating Metabolic Pollutant Generation Rates (CO)

There are many regulations which endorse modelling occupant pollutant generation accumulation within buildings. For occupants, this pertains to carbon dioxide (CO2). Most standards set thresholds which should not be exceeded:

  • ASHRAE Standard 62.1
  • CIBSE Guide A
  • WELL Building Standard
  • LEED 
  • BREEAM 

Building simulation software often takes the CO2 generation rate as an input to the calculation, but modellers often are presented with a simple ‘number of occupants’ to base their assumptions on when it comes to occupancy gains and their pollutant generation rates. 

In this blog post, we’ll explore the relationship between ‘number of occupants’ and ‘CO2 generation rate’, and produce a basic calculator which can be used to aid calculating CO2 generation rates depending on the information you have available.

Why do our bodies produce CO2?

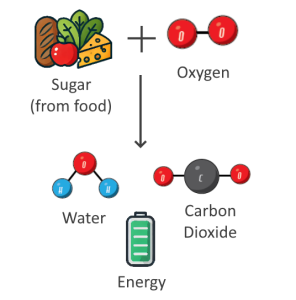
In order to convert food into energy, our bodies convert glucose and oxygen into energy, carbon dioxide and water. This process is known as respiration.

As most of us don’t just eat sugar (glucose), our bodies also have to convert things like proteins and carbohydrates into glucose at the start of the process. 

Converting different foods into glucose also requires energy, which is why metabolising different foods produces varying amounts of CO2. 

The equation for respiration is:

\( \text{C}_6\text{H}_{12}\text{O}_6 + 6 \, \text{O}_2 \rightarrow 6 \, \text{CO}_2 + 6 \, \text{H}_2\text{O} + \text{Energy (ATP)} \)

That is, glucose + oxygen -> carbon dioxide + water

sugar plus oxygen are used in respiration to produce water, carbon dioxide and metabolic energy.

What affects CO2 Generation Rates?

If you selected two random people from different age groups, genders and level of fitness and measured how much carbon dioxide these people expelled over the course of an hour, you would probably find that the amount of CO2 produced can vary quite significantly. This is because the amount of CO2 a person produces depends heavily on their diet and metabolism:

  • Metabolic Rate: This is the rate at which your body burns calories at rest. Higher metabolic rate = more CO2.
  • Physical activity level: When we exercise, we burn more calories and produce more CO2.
  • Diet: Different food gets metabolised into different amounts of CO2 due to different metabolic pathways. Eating more protein can produce more CO2 compared to carbohydrates. 
  • Body size & composition: An increase in body weight is usually associated with a higher metabolic rate
  • Age and gender: Metabolic rate usually declines with age. Men tend to have higher metabolic rates than women.
  • Environmental factors: Temperature and altitude can affect how our body produces energy (and CO2 as a biproduct).
  • Health conditions: e.g. hyperthyroidism can increase metabolic rate and therefore CO2 production.

Respiratory Quotient (RQ)

From the respiration equation mentioned earlier, we can see that the amount of CO2 a person produces is directly related to how much oxygen they consume during respiration.

The ratio of CO2 relesed to O2 consumed is known as the Respiratory Quotient (RQ):

\( \text{RQ} = \frac{\text{Volume of } \text{CO}_2 \, \text{produced}}{\text{Volume of } \text{O}_2 \, \text{consumed}} \)

We mentioned earlier that different foods are converted to glucose in order for respiration to take place. As this conversion, known as gluconeogenesis, relies on energy to take place, this implies that different foods consumed result in different amounts of CO2 being produced during metabolism. Therefore, the RQ varies depending on diet, and some example figures are given in the tables below.

Converting number of people to CO2 generation rates

In order to derive a relation between the number of people in a space and the amount of CO2 produced by each person per hour, we will use the following relation:

“For every 1 litre of oxygen the body uses, approximately 5 calories are expended”

Calories are a measure of how much energy we can consume during respiration, so therefore if we calculate how much oxygen a person consumes, we can use the Respiratory Quotient to determine how much CO2 is produced as a biproduct. 

We can relate kcals to Joules with the following relation:

  • \( 1 \, \text{kcal} = 4184 \, \text{Joules (J)} \)

And Watts, which we often use in building simulation software as an input, are related to joules by:

  • \( 1 \, \text{Watt (W)} = 1 \, \frac{\text{Joule (J)}}{\text{Second (s)}} \)

Putting these relations together, we can deduce:

  • \( 1 \, \text{litre O}_2/\text{min} \times 5 \, \text{kcal}/\text{litre O}_2 \times 4184 \, \text{J}/\text{kcal} = 20920 \, \text{J}/\text{min} \)

Converting to Joules per second (Watts):

  • \( \frac{20920 \, \text{J}/\text{min}}{60 \, \text{sec}/\text{min}} = 348.67 \, \text{J}/\text{sec} = 348.67 \, \text{Watts} \)

For 1 ml O2/ minute:

\( \frac{348.67 \, \text{Watts}}{1000 \, \text{ml}/\text{litre}} = 0.34867 \, \text{Watts}/\text{ml}/\text{O}_2/\text{min} \)

So therefore:

\( \text{Metabolic Rate (W)} = \text{VO}_2 \, (\text{ml}/\text{min}) \times 0.34867 \)

Rearranging so that we can calculate VO2:

\( \text{VO}_2 \, (\text{ml}/\text{min}) = \frac{\text{Metabolic Rate (W)}}{0.34867} \)

And converting to CO2 by multiplying by the Respiratory Quotient (RQ):

\( \text{CO}_2 \, (\text{ml}/\text{min}) = \frac{\text{Metabolic Rate (W)}}{0.34867} \times \text{RQ} \)

Converting to litres/hour:

\( \text{CO}_2 \, (\text{L}/\text{hour}) = \left( \frac{\text{Metabolic Rate (W)}}{0.34867} \right) \times \text{RQ} \times \frac{60}{1000} \)

Example Metabolic Rates

This table lists some rate of heat emissions for mixtures of males/females. 

Degree of Activity Typical Building Total Rate of Heat Emission (W) Sensible Heat (W) Latent Heat (W)
Seated at theatre Theatre, cinema (matinee) 95 65 30
Seated at theatre, night Theatre, cinema (night) 105 70 35
Seated, very light work Offices, hotels, apartments 115 70 45
Moderate office work Offices, hotels, apartments 130 75 55
Standing, light work; walking Department store, retail store 130 75 55
Walking; standing Bank 145 75 70
Sedentary work Restaurant 160 80 80
Light bench work Factory 220 80 140
Moderate dancing Dance hall 250 90 160
Walking; light machine work Factory 295 110 185
Bowling Bowling alley 425 170 255
Heavy work Factory 425 170 255
Heavy machine work; lifting Factory 470 185 285
Athletics Gymnasium 525 210 315

Source: ASHRAE Handbook: Fundamentals (2001)

Example Respiratory Quotients (RQ)

Substrate Respiratory Quotient (RQ)
Carbohydrate 1.00
Fat 0.696
Protein 0.818
Non Dairy 0.86
Mixed Diet 0.8

Source: Exercise Physiology. Nutrition, Energy, and Human Performance by William D. McArdle, Frank I. Katch, Victor L. Katch  & Wikipedia 

Putting it all together: Example

Let’s calculate the CO2 pollutant generation rate for an office with 1 occupant and a floor area of 3m2. Assumptions:

  • Metabolic rate 130W (Moderate office work)
  • Mixed diet (RQ = 0.8)
The calculation is therefore:
 
\( \text{CO}_2 \, (\text{L}/\text{hour}) = \left( \frac{130}{0.34867} \right) \times 0.8 \times \frac{60}{1000} = 17.897 \)
 
And to convert to litres / hour / m2, divide by the floor area:
 
\( \text{CO}_2 \, (\text{L}/\text{hour}/\text{m}^2) = \frac{\text{CO}_2 \, (\text{L}/\text{hour})}{\text{Area} \, (\text{m}^2)} = \frac{178.97}{3} = 5.97 \, \text{L}/\text{hour}/\text{m}^2 \)

Carbon Dioxide Calculator

To save time, you can use the following handy carbon dioxide pollutant generate calculator to help calculate pollutant generation rates for use in Tas:

This calculator uses the methods discussed above to equate number of occupants to CO2 pollutant generation rates. If you would like us to add more activity levels to this calculator, please get in touch. As metabolic rates vary so significantly between individuals, we would always recommend performing sensitivity analysis to ensure your buildings perform well given the inherent uncertainty in the pollutant generation rates. 

Other useful conversions

In building simulation software, we often work with Watts as our primary unit for metabolic rates as these directly relate to the amount of sensible and latent heat gain occupants emit into a space. In other industries, however, it is quite common to work with METs.

What is a MET?

1 MET is the rate of energy expenditure at rest, approximately equal to 1 kcal per kg of body weight per hour, or 3.5 mL of oxygen consumed per kg of body weight per minute

Converting METs to Watts

Converting METs to Watts is fairly straightforward if you know the body weight of the individual:

\( \text{Watts (W)} = \text{MET} \times \text{Body Weight (kg)} \times 1.225 \)

Converting Watts/m2 to Watts

Sometimes heat generation rates for a given activity are specified in terms of W/m2, so therefore they need to be multiplied by the surface area of a human body. The average surface area of an adult human body is 1.8m2, so this may be helpful if you are using Table 1.4 from CIBSE guide A. 

Body Weight (kg) Surface Area (m²)
1 0.10
2 0.16
4 0.26
6 0.34
8 0.42
10 0.49
15 0.65
20 0.79
25 0.92
30 1.10
35 1.20
40 1.30
Table of body surface area in children, taken from nice.org.uk

Calculating CO2 generation for different age groups

To calculate CO2 generation rates for different age groups, first look up the average body weight by expected age of the occupant in the following table:

Age Range Average Weight (kg)
0-6 months 3.3 - 7.5
1-2 years 7.9 - 9.2
2-4 years 12 - 15
8-10 years 19.5 - 25.5
14-16 years 45 - 53
18-20 years 56 - 58

Next, look up the average surface area from the body weight vs surface area table above. Or, for an adult male, assume 1.8m2 as per CIBSE guide. 

Then, look up the heat generation rate per unit area of body from the following table:

Activity Heat Generation (W/m²)
Resting
Sleeping 41
Reclining 46
Seated, Quiet 58
Standing, Relaxed 70
Walking (Level)
0.9 m/s 116
1.3 m/s 151
1.8 m/s 221
Office Work
Reading, Seated 58
Writing 58
Typing 64
Filing, Seated 70
Filing, Standing 81
Lifting/Packaging 122
Occupational
Cooking 81-134
House Cleaning 99-198
Seated, Heavy Limb Movement 128
Machine Sawing 105
Light Machine Work 93-116
Heavy Machine Work 175
Handling 50 kg Bags 233
Leisure
Dancing 82-256
Tennis 210-233
Basketball 294-442
Wrestling 407-506

Figures for this table were taken from CIBSE guide A 2006, Table 1.4

Multiply the average surface area by the Heat Generation from the table above to get a metabolic rate in Watts, which you can then enter into the calculator above by selecting the Other option.