Understanding Load Calculations in Building Simulation: Coincidental Loads vs. Steady-State Loads
In the world of building design and simulation, accurately calculating loads is essential for ensuring optimal performance and energy efficiency. As buildings evolve to meet the demands of modern life, understanding the nuances of different load types becomes increasingly critical. Among these, coincidental loads and steady-state loads play pivotal roles in how we design systems that can adapt to varying conditions.
In Tas, loads can be calculated using Heating & Cooling Design Days via the Design Day Wizard, or directly from the Dynamic Simulation Results. In this blog post, we will explore the difference between the two methods and how this relates to coincidental and steady state loads.
Steady-State vs Dynamic Loads
Before we discuss what coincidental loads are, we need to discuss the difference between steady-state and dynamic loads.
Steady-state loads are characterised by their predictability and consistency over time. For instance, the Chartered Institution of Building Services Engineers (CIBSE) employs steady-state heating design day calculations to establish the heating requirements of a building.
These calculations assume constant conditions for each hour of the design day, including factors such as indoor temperature, occupancy, and weather patterns. A fixed external dry bulb temperature is selected, usually -4°C in the UK, and solar , occupancy and equipment gains are removed. As the hourly conditions do not change from hour to hour, they are considered to be steady and therefore simulating this day over and over should eventually cause the results to converge.
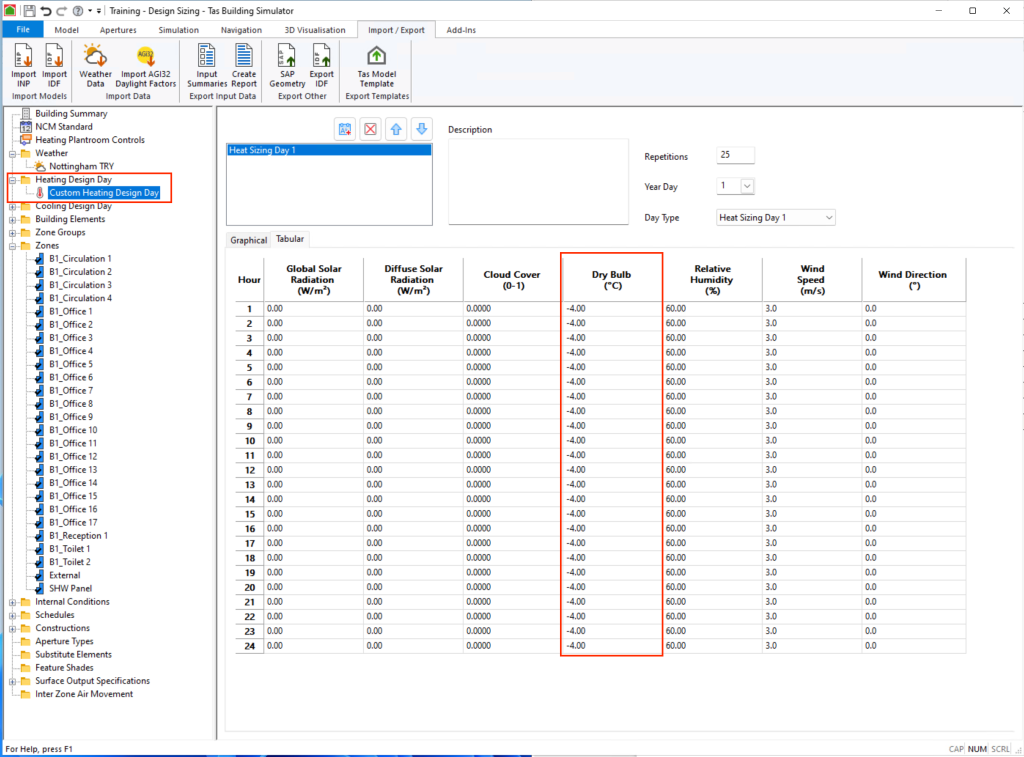
The Design Day Wizard simplifies this process, allowing you to set up these calculations efficiently.
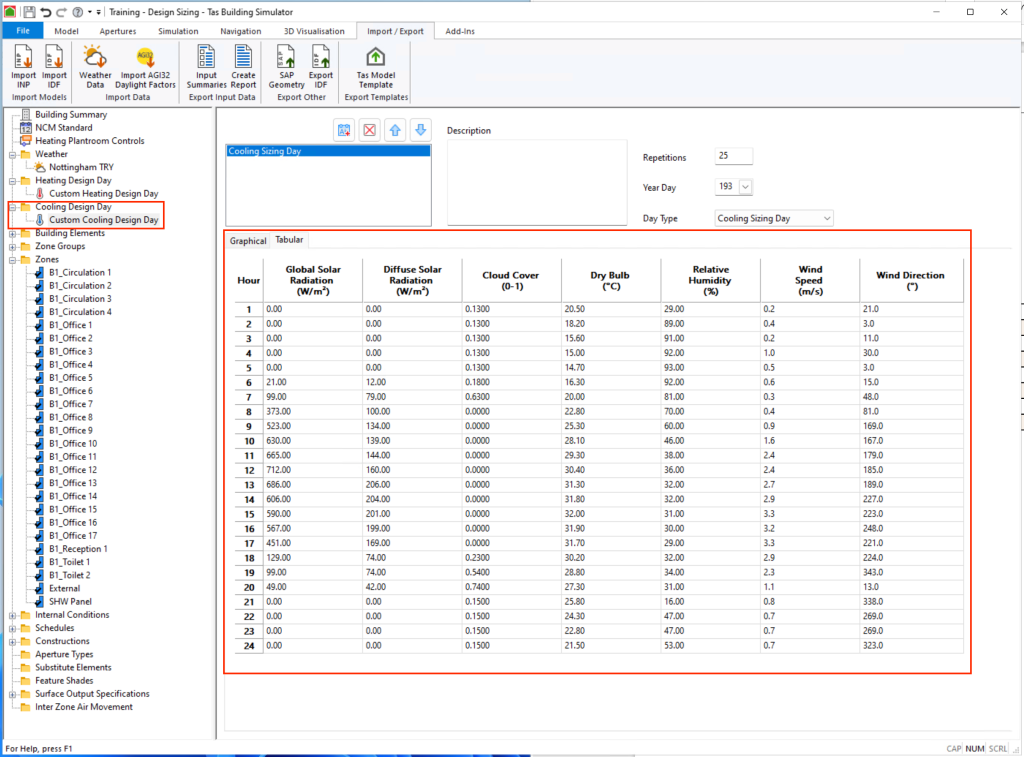
Similarly, the Design Day Wizard can also be utilised for cyclic cooling design day calculations, which differ slightly in that the same day of weather is simulated repeatedly but the weather does typically vary throughout the day:
Advantages of Steady-State Loads:
- Simplicity: Steady-state calculations are relatively straightforward and easy to implement, making them accessible for designers.
- Consistency: They provide reliable estimates for typical operating conditions, allowing for easier compliance with regulations and standards.
- Time Efficiency: The use of tools like the Design Day Wizard streamlines the process.
Disadvantages of Steady-State Loads:
- Oversizing Risk: These calculations often lead to oversizing of systems since they focus on worst-case scenarios or peak demands that may not occur simultaneously. As a result, systems may be designed to handle maximum loads that are infrequent or unlikely.
- Lack of Flexibility: Steady-state calculations do not account for fluctuations in usage or environmental conditions, which can lead to inefficiencies and higher operational costs.
- Limited Realism: By neglecting the dynamic nature of actual building usage, steady-state calculations may not accurately reflect how systems will perform under varying conditions, potentially resulting in increased energy consumption.
In contrast, dynamic loads fluctuate in response to varying conditions and usage patterns, leading to the concept of coincidental loads.
What are Coincidental Loads?
Imagine you are simulating a building with 5 zones. These zones are called Zone A, Zone B, Zone C etc. You simulate the entire year, and have results for every hour of the year for these zones…
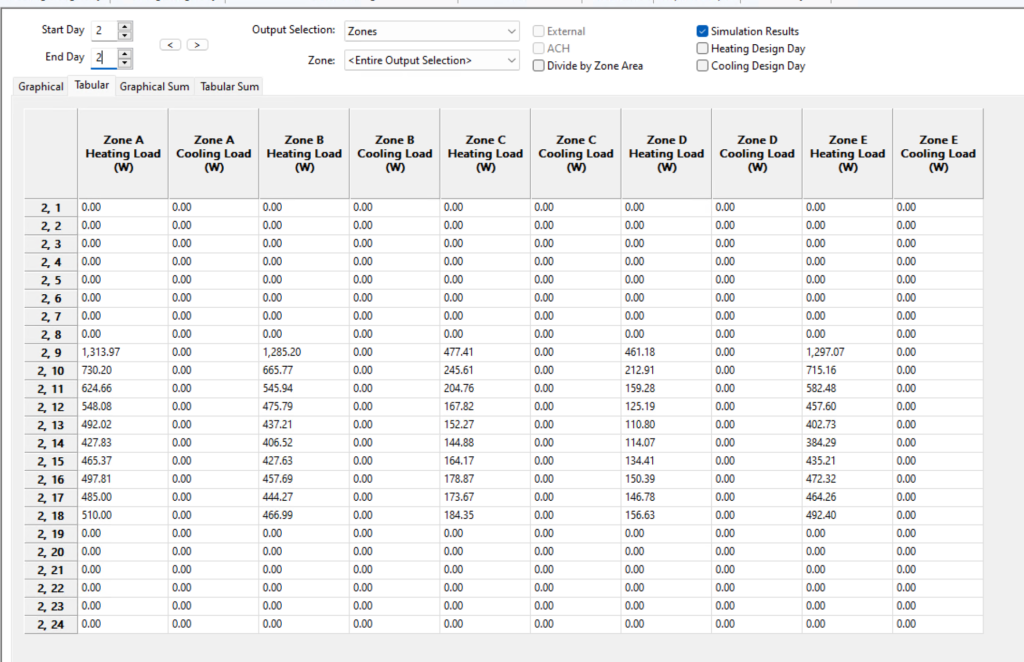
One way of determining the Peak Load for these zones would be to find the maximum value in each column and sum them:
| Office Zone | Individual Peak Heating Load (W) | Peak Occurrence Time |
|---|---|---|
| Zone A | 10,000 | Day 1, 9:00 AM |
| Zone B | 8,000 | Day 5, 9:00 AM |
| Zone C | 12,000 | Day 5, 10:00 AM |
| Zone D | 6,000 | Day 12, 11:00 AM |
| Zone E | 5,000 | Day 11, 2:00 PM |
| Total Individual Peak | 41,000 |
The total individual peak loads for each office zone represent the maximum heating demand that each zone can reach. However, these peaks may not occur simultaneously; they could happen on different days and at different times.
As a result, the peak load that an HVAC system needs to accommodate when conditioning these spaces is not simply the sum of the individual peak loads. Instead, the actual peak load for the HVAC system corresponds to the specific day and hour when the combined loads of all zones are at their highest.
This is known as a coincidental load, which represents the maximum demand that the HVAC system must be prepared to meet when all zones reach their peak demand at the same time.
| Hour | Zone A Heating Load (W) | Zone B Heating Load (W) | Zone C Heating Load (W) | Zone D Heating Load (W) | Zone E Heating Load (W) | Total Heating Load (W) |
|---|---|---|---|---|---|---|
| 2, 9 | 1,313.97 | 1,285.20 | 477.41 | 461.18 | 1,297.07 | 4,834.83 |
| 2, 10 | 730.20 | 665.77 | 245.61 | 212.91 | 715.16 | 2,578.65 |
| 2, 11 | 624.66 | 545.94 | 204.76 | 159.28 | 582.48 | 2,116.12 |
| 2, 12 | 548.08 | 475.79 | 167.82 | 125.19 | 457.60 | 1,774.48 |
| 2, 13 | 492.02 | 437.21 | 152.27 | 110.80 | 402.73 | 1,595.03 |
| 2, 14 | 427.83 | 406.52 | 144.88 | 114.07 | 384.29 | 1,477.59 |
| 2, 15 | 465.37 | 427.63 | 164.17 | 134.41 | 435.21 | 1,826.99 |
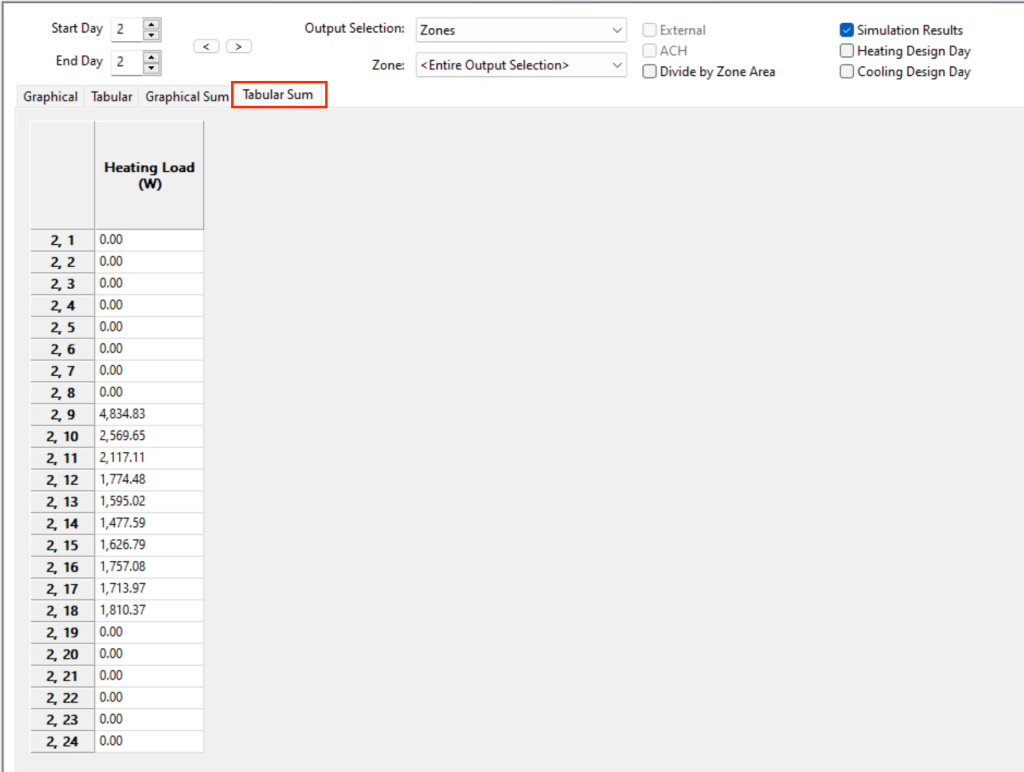
So, to be clear, the coincidental load is found by summing the rows and finding the maximum value in the Total Heating Load column throughout the year.
In Tas, this is easily achieved in the results viewer by using the Tabular Sum table:
Coincidental Loads & Design Days
Heating Design Days produce a steady state result; the result converges, so the simulation results are the same for each hour:
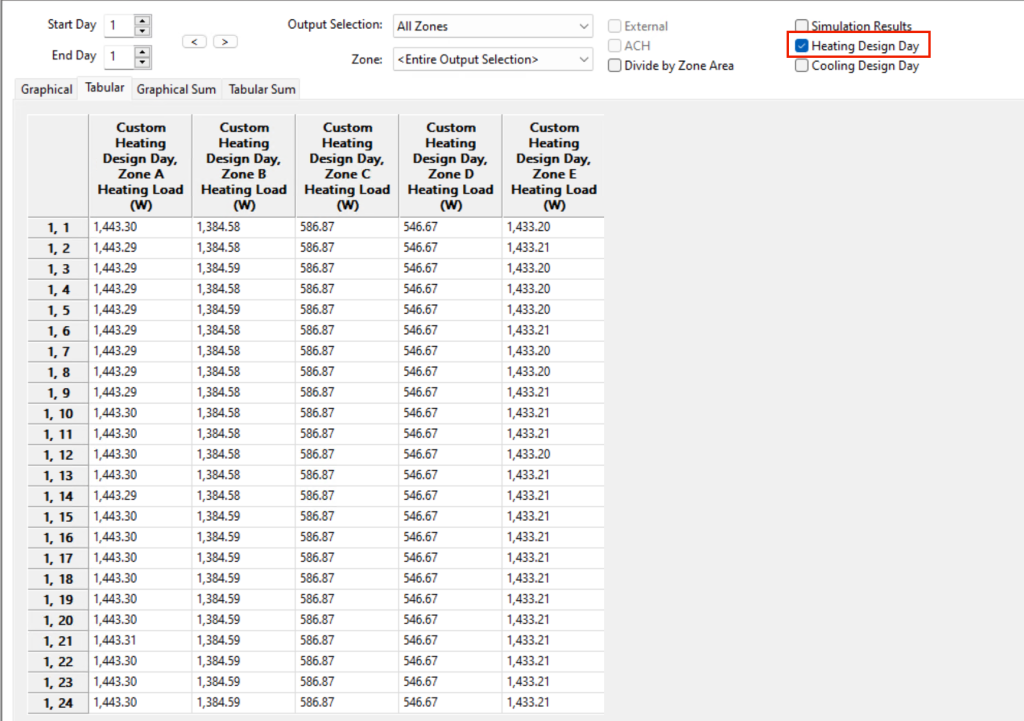
As the results are the same for every hour, the coincidental peak is the same as the sum of the individual peaks due to the nature of the calculation.
With cyclic cooling design days, the results may vary hour to hour so it is possible that the coincidental load may be different to the sum of the individual peaks:
| Hour | Zone A (W) | Zone B (W) | Zone C (W) | Zone D (W) | Zone E (W) | Coincidental (W) |
|---|---|---|---|---|---|---|
| 193, 1 | 0 | 0 | 0 | 0 | 0 | 0 |
| 193, 2 | 0 | 0 | 0 | 0 | 0 | 0 |
| 193, 3 | 0 | 0 | 0 | 0 | 0 | 0 |
| 193, 4 | 0 | 0 | 0 | 0 | 0 | 0 |
| 193, 5 | 0 | 0 | 0 | 0 | 0 | 0 |
| 193, 6 | 0 | 0 | 0 | 0 | 0 | 0 |
| 193, 7 | 0 | 0 | 0 | 0 | 0 | 0 |
| 193, 8 | 0 | 0 | 0 | 0 | 0 | 0 |
| 193, 9 | 0 | 0 | 0 | 0 | 32.42 | 32.42 |
| 193, 10 | 744.19 | 806.96 | 329.64 | 366.47 | 804.12 | 3051.38 |
| 193, 11 | 817.84 | 877.64 | 359.59 | 395.19 | 896.80 | 3347.06 |
| 193, 12 | 878.05 | 936.04 | 385.12 | 420.38 | 971.08 | 3590.67 |
| 193, 13 | 917.72 | 976.72 | 403.29 | 440.83 | 1,005.45 | 3744.01 |
| 193, 14 | 975.07 | 1,011.81 | 430.39 | 452.72 | 1,047.70 | 3917.69 |
| 193, 15 | 1,026.89 | 1,032.86 | 458.94 | 458.89 | 1,083.71 | 4061.29 |
| 193, 16 | 1,067.16 | 1,039.12 | 486.24 | 459.08 | 1,107.94 | 4159.54 |
| 193, 17 | 1,099.06 | 1,043.97 | 501.24 | 456.24 | 1,128.63 | 4229.14 |
| 193, 18 | 1,020.67 | 995.22 | 434.54 | 423.60 | 1,044.74 | 3918.77 |
| 193, 19 | 0 | 0 | 0 | 0 | 0 | 0 |
| 193, 20 | 0 | 0 | 0 | 0 | 0 | 0 |
| 193, 21 | 0 | 0 | 0 | 0 | 0 | 0 |
| 193, 22 | 0 | 0 | 0 | 0 | 0 | 0 |
| 193, 23 | 0 | 0 | 0 | 0 | 0 | 0 |
| 193, 24 | 0 | 0 | 0 | 0 | 0 | 0 |
In this case, the sum of the individual peaks (4231.98W) is slightly larger than the coincidental peak (4,229.14W). If the peak for zone D occurred at hour 17 as with the other zones, the coincidental peak would be equal to the sum of the individual peaks.
Finding Coincidental Peaks in Tas
The method you use to obtain coincidental loads from Tas depends if you are using design days or the dynamic simulation.
Design Days
If your design day is steady state, i.e. the results are not varying hour by hour, the coincidental load is equal to the peak load so the results from the design day wizard and the peak zone loads report can be used directly. They will be equal.
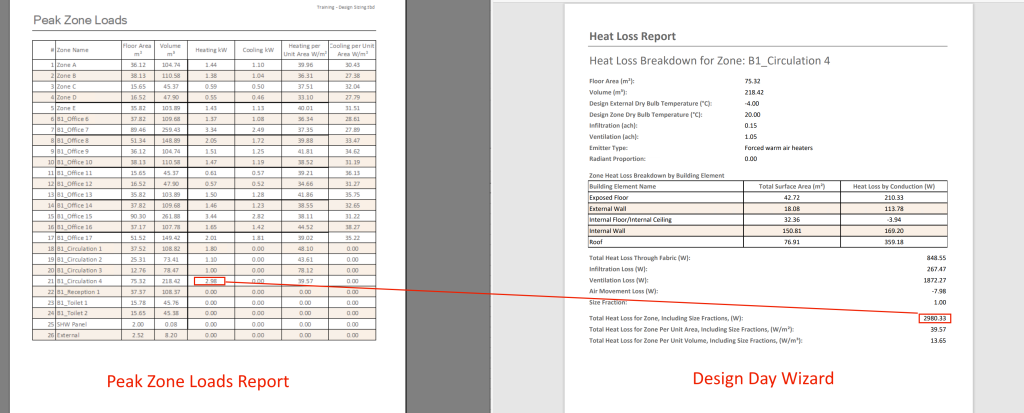
If your design day is cyclic as is often the case with cooling design days, you can obtain the coincidental peak by looking at the tabular sum results in the TSD file and finding the maximum value.
Dynamic Simulation
If you are obtaining loads from the dynamic simulation, the Peak Loads report will report the coincidental peak in addition to the individual peaks, for the zones included in the report.
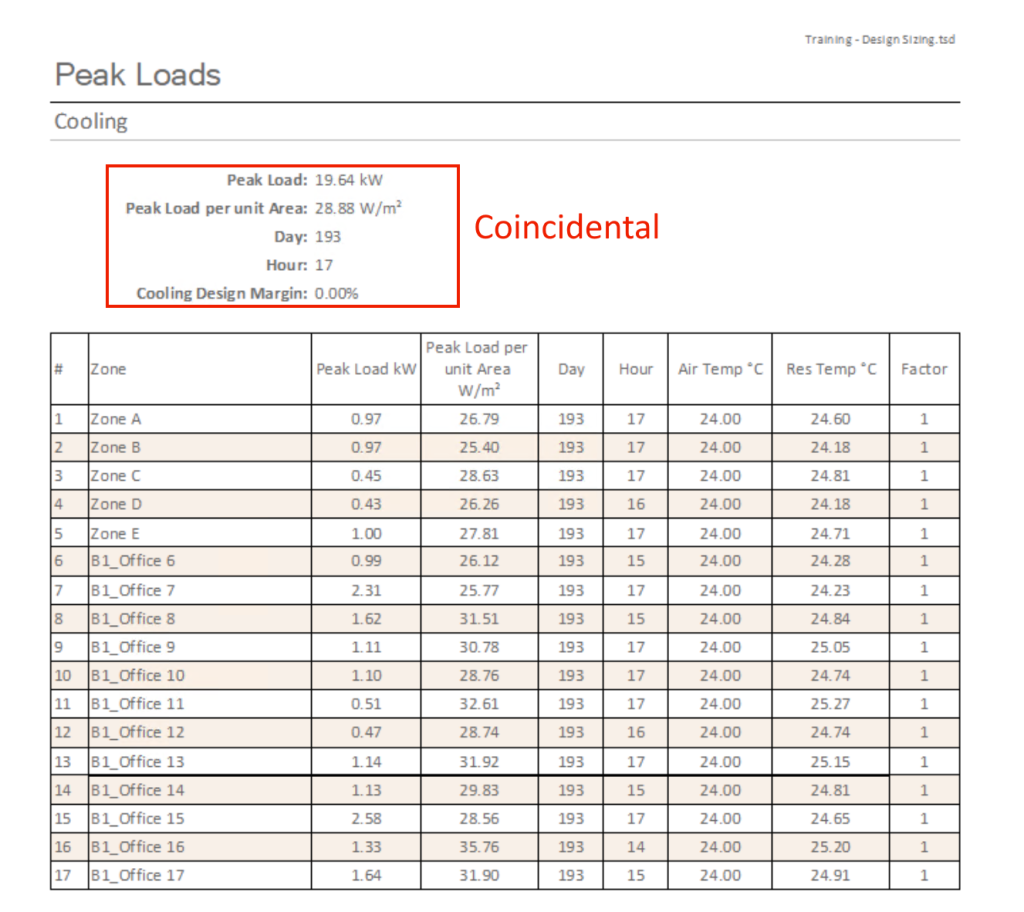
You can also obtain the coincidental peak from the dynamic simulation by looking at the tabular sum in the TSD results and finding the peak.
