Getting Started
Opening TasGenOpt
TasGenOpt can be opened via the Tas Manager. Set your project directory and then right click in the folder and click TasGenOpt.
- The project directory you select should contain the Tas files you wish to work with.
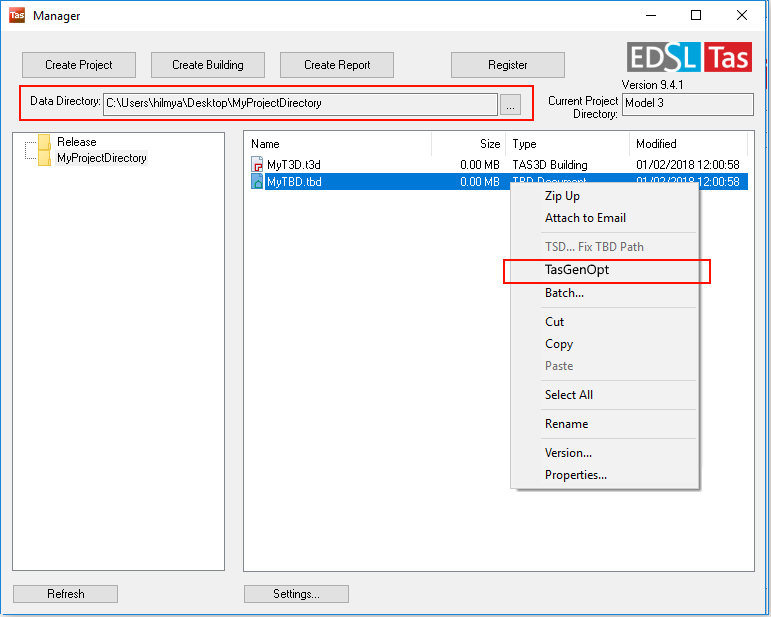
- TasGenOpt will then open on the Scripting tab:

You can also open TasGenOpt via the Utilities folder in the Tas Manager.
Main Tas Script
This is where you write your own script using C#. The script is automatically saved when you click out of the text editing region as a text file in your project directory.
When you are done writing your script, you should press the Build button in the toolbar to check for problems with the script.
Warning
If you do not set a value for each of the output variables you have added to your project, your script will not simulate.
For more information about writing scripts, please see Writing a Script.
Example Scripts
The Scripts panel contains a collection of snippets of code you can browse to learn how to do things in TasGenOpt. Double clicking on one will open the script in a new tab. The scripts have comments to explain how they work, and can be copy and pasted into your main Tas script.
You can add your own scripts to this collection so you can reuse them later by adding them to the appropriate folder in your Tas Program Files directory.
Tas Files
The Tas files that are in the project directory are listed in this panel, and the file path to the file can be added to your main Tas script by right clicking on the file and clicking insert reference.
Input Variables
- Input variables are things you wish to change each time the script runs. Examples of possible input variables are:
Window widths/heights
North angle
Shade angles
Material conductivities
Heating/cooling efficiencies
Heating/cooling setpoints
Each input variable must have a unique name, and the allowed range of values for the variable can be specified in this panel.
The Step property determines how much the variable is changed by each time the script runs.
Output Variables
- Output variables are values that change each time the script runs, that you are interested in. Examples include:
Internal temperature
CO2 emissions
Heating/Cooling demand/consumption
Humidity
Daylight factors
All but one output variable defined in this window are for information purposes only, and are displayed on the results graph on the Simulate tab.
The only output variable that is compulsory and affects the values of the variables in the next simulation is the Result output variable. The Result output variable represents the value of the cost function that will be minimised by the GenOpt program.
The values of the output variables are set in your Tas script by writing something like this:
ScriptOutput.SetValue("MyOutputVariable",0);
In the above, the output variable called ‘MyOutputVariable’ has been set to the value of 0.
For more information about creating a cost function, please see Writing a Script.
Script Problems
When you press Build, your script is checked for problems. If any problems are found, they will be listed in this window. Any errors will prevent the script from running at all, whereas warnings are just for information purposes.
Note
Errors that occur when the script is running cannot be predicted by pressing Build, so problems may still occur when simulating.
Simulating
- When you are ready to simulate, switch to the Simulate tab:
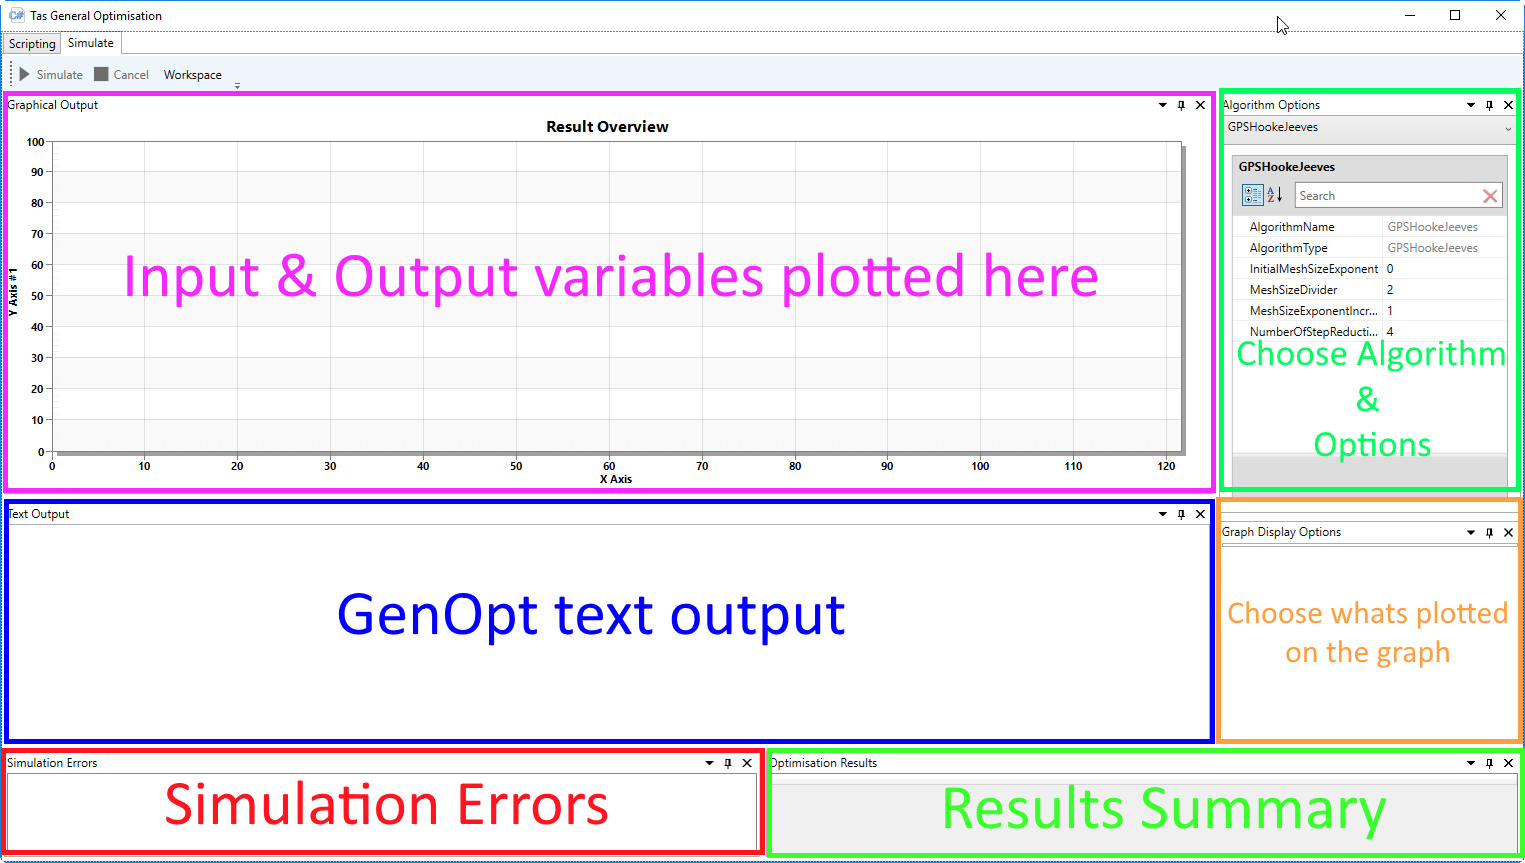
Algorithm Options
- The algorithm you wish to use for optimisation can be selected from the dropdown in this panel. There are lots of options depending on your situation. Options include:
Parametric (when one input variable is changing)
Mesh (like parametric, but multiple input variables can change)
GPS Hookes Jeeves (multiple variables to be optimised)
Golden Section (when one variable is to be optimised)
Each algorithm has many options associated with it. For a description of which algorithm to use and when, and what the various options do, please consult the GenOpt manual.
Note
If an inappropriate algorithm option is selected, the simulation will fail. Please keep an eye on the GenOpt text output if it appears your simulation doesn’t start.
Graphical Output & Graph Display Options
After pressing simulate, results will start to appear on the graph along with the input and output variables associated with that particular simulation. The graph can get quite busy, so you can prevent variables from being plotted by unchecking them in the Graph Display Options pane.
The Graph Display Options pane will be empty until the first simulation has been completed.
Results Summary
The results summary window will display the input and output variables associated with the last simulation performed. For most algorithm options, this will be the optimised result.
For parametric style algorithms, such as ‘mesh’ and ‘parametric’, the last simulation performed will be summarised here.